


Examining Inflation Indices for Regulating Market Dominant Price Increases
- Research and Insights Solution Center -
United States Postal Service Office of Inspector General


Postcards. Glossy magazines. Letters to grandparents and greeting cards to loved ones. We trust the U.S. Postal Service to deliver mail to the people we love most. But the cost to send First-Class Mail (FCM) and other important mailpieces continues to rise as prices go up — sometimes twice in one year.
What's driving these price increases?
USPS Price Cap and the CPI-U Inflation Index


The Postal Service holds a monopoly over First-Class Mail and other similar products: letters, catalogs, bills, invoices, and more. However, USPS's ability to increase prices is bound by a Congressionally mandated upper limit called a price cap.
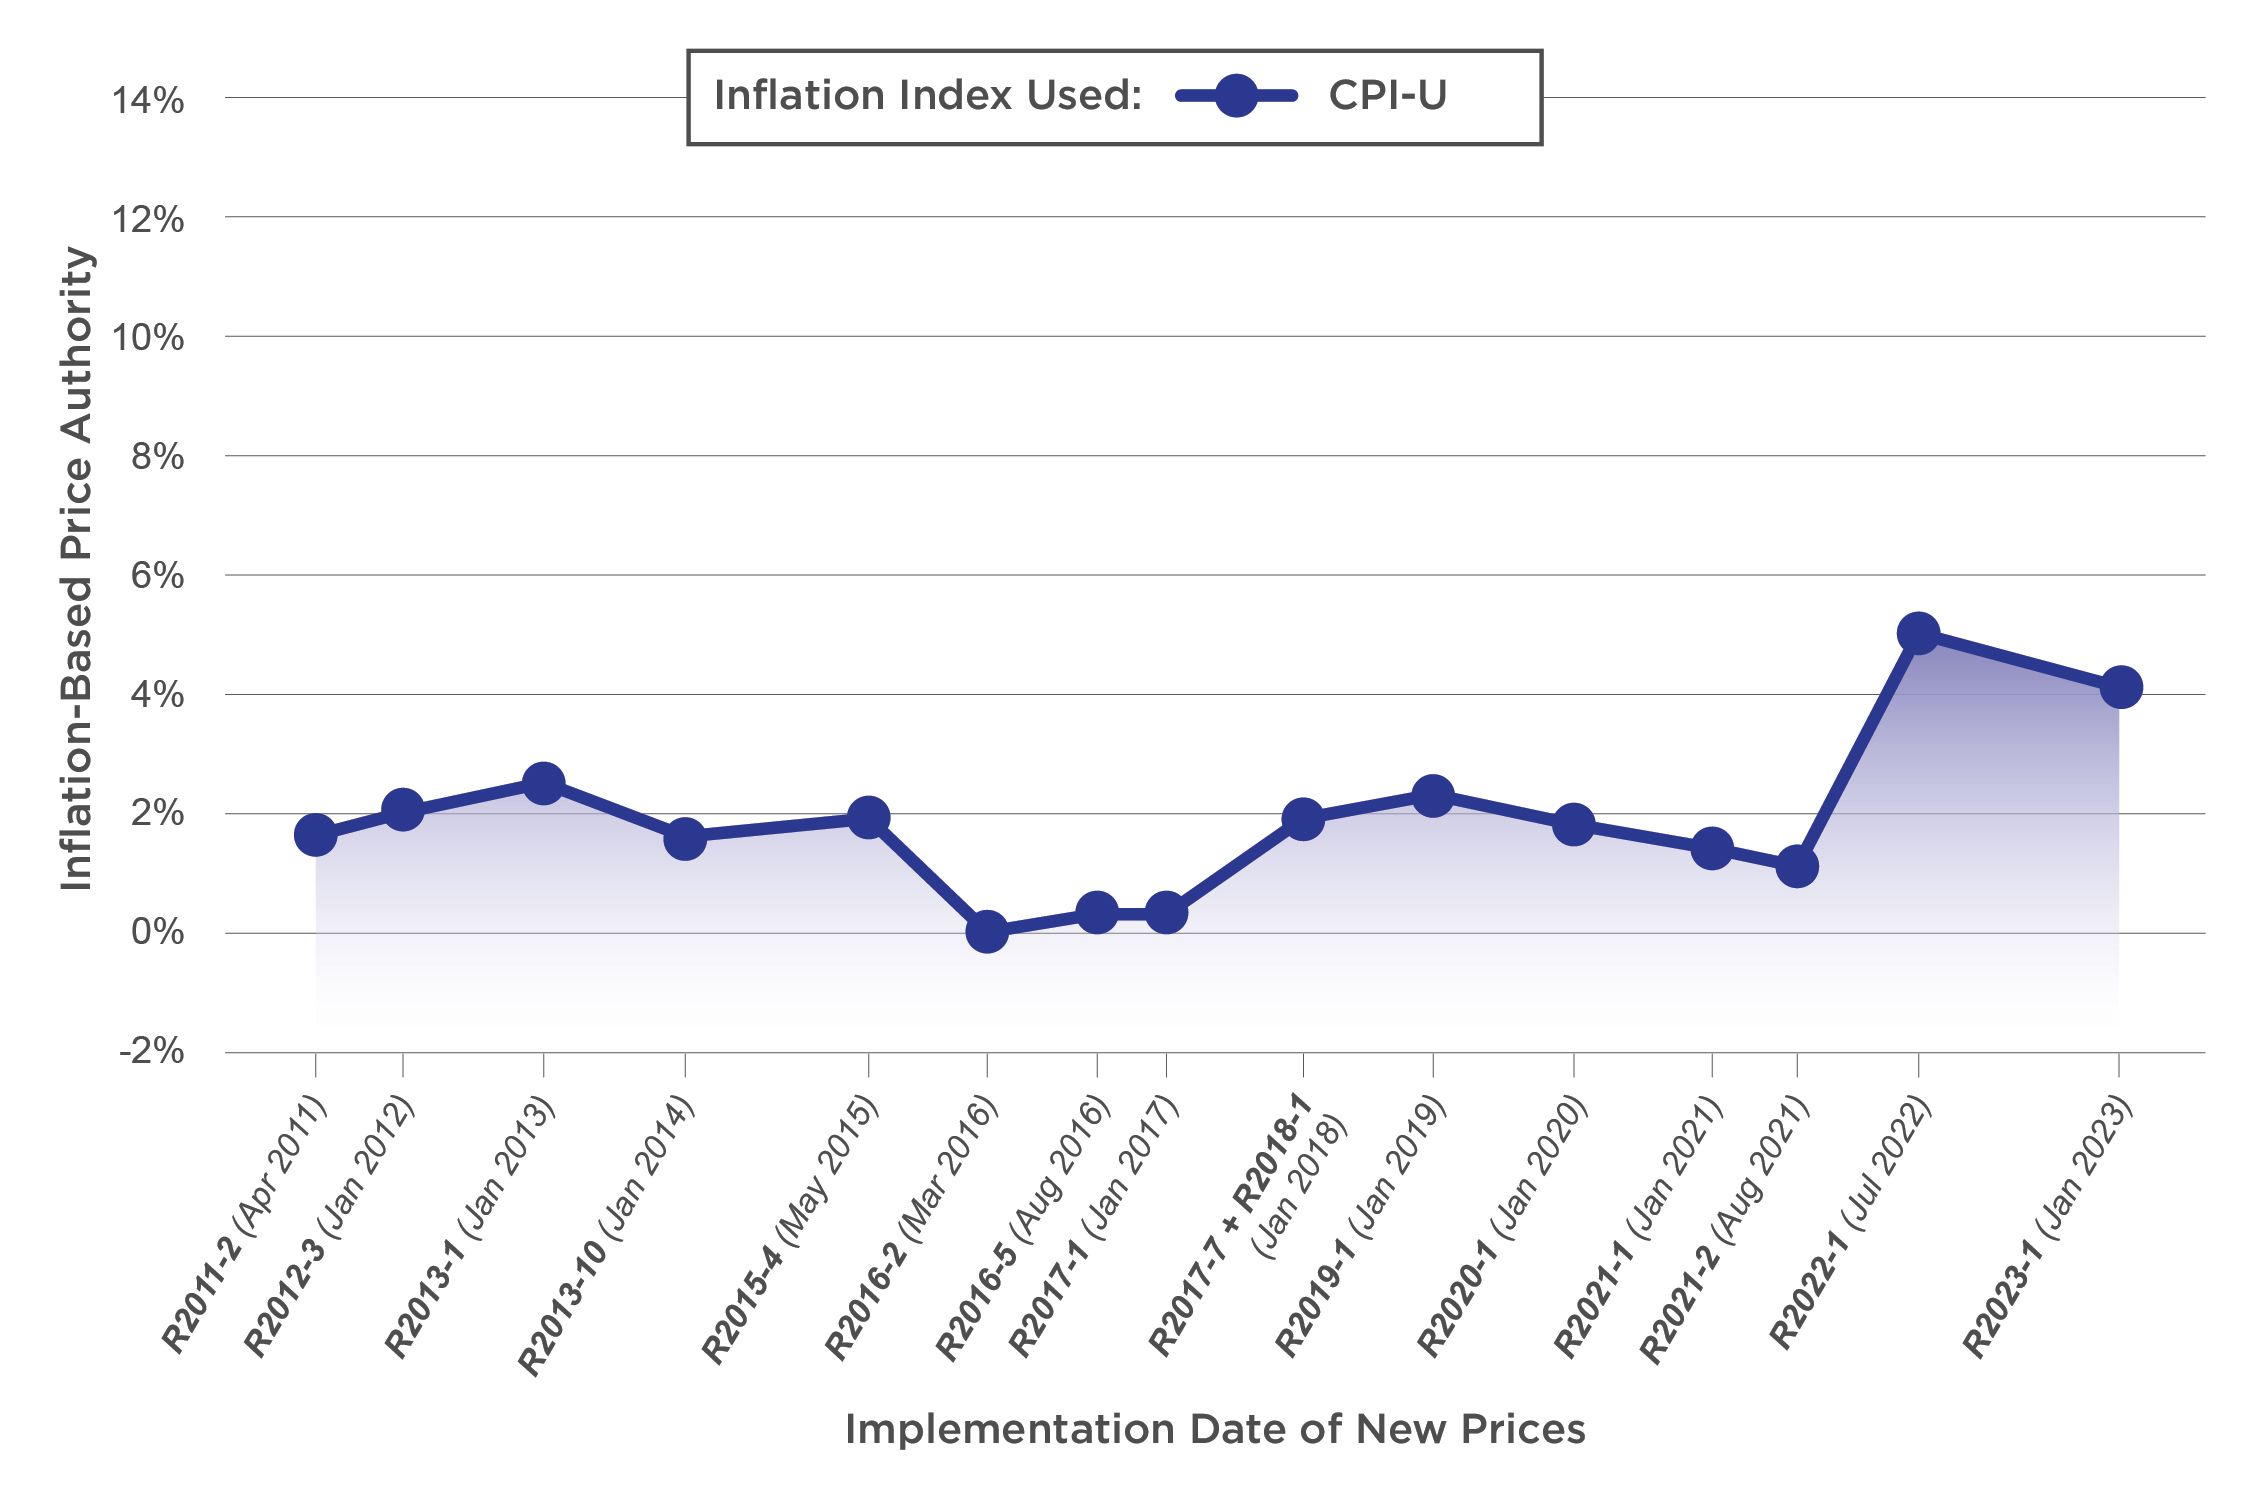
The Postal Service's price cap is tied to inflation, which drives the majority of USPS's price increases. That is, a higher inflation rate could lead to a higher price cap, which could correspond to a larger price increase. Currently, the agency must measure inflation using the Consumer Price Index for All Urban Consumers (CPI-U) — the most widely used measure of inflation.
Rate Cases


The Postal Regulatory Commission (PRC) must approve each of the Postal Service's rate increases in a process called a rate case. Between fiscal years (FYs) 2011 and 2022, the PRC granted USPS additional price authority (that is, the ability to increase prices) in 16 rate cases based on the CPI-U. These rate cases added up to a cumulative 33.5% price authority for USPS.

Source: USPS OIG analysis.
Source: USPS OIG analysis.
The USPS Office of Inspector General (USPS OIG) analyzed six alternative inflation indices to determine how they might impact rates, revenue, and cost coverage between FYs 2011 and 2022. Each of these indices used different methodologies to track different sets of prices, resulting in different rates of inflation.
Alternative Inflation Indices


How would an alternative inflation index impact price increases? To find out, we estimated USPS's potential price authority under six other inflation indices. Our results are below.
Lower Price Authority: Three Indices
In general, most indices behaved similarly to the CPI-U. Three of our six indices would have resulted in less price authority than the CPI-U between FYs 2011 and 2022.
Personal Consumption Expenditures Price Index (PCE PI)
Source: USPS OIG analysis.
Source: USPS OIG analysis.
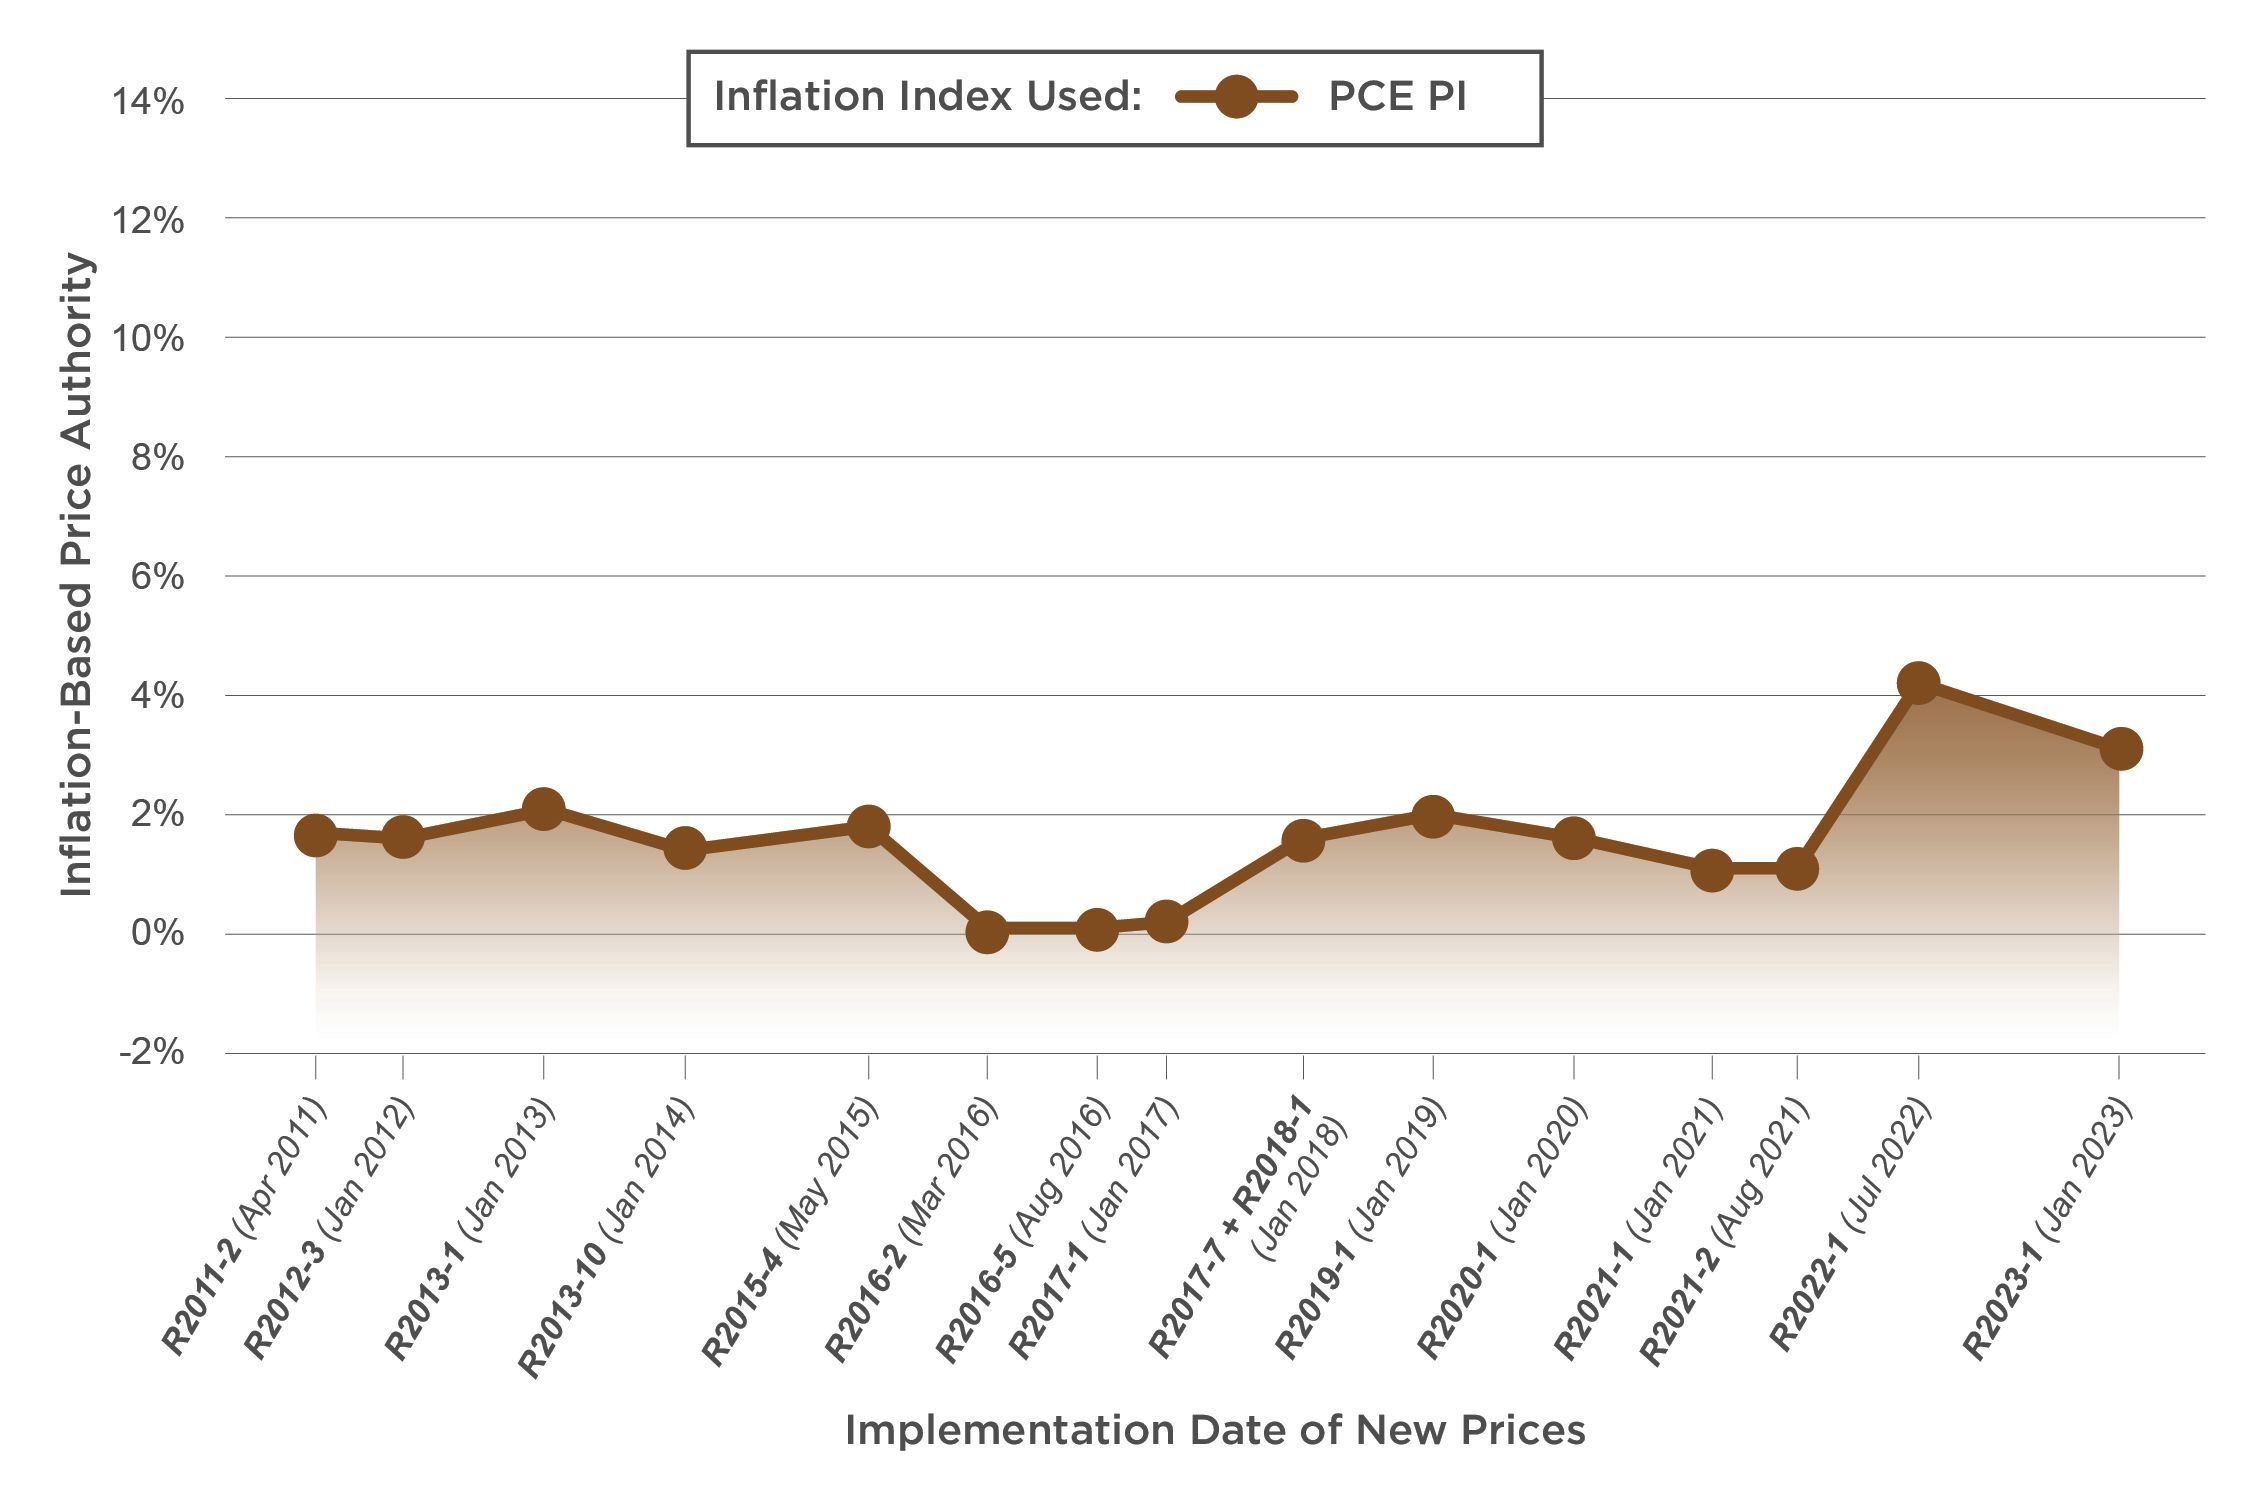
For example, the PCE PI would have consistently resulted in lower price increases than the CPI-U, yielding less price authority in 13 of 16 rate cases. PCE PI's cumulative change in price authority would have been 5.1 percentage points less than CPI-U's cumulative change.
In other words, if the Postal Service had opted to use the PCE PI to measure inflation instead of the CPI-U, it would have ended up with less price authority — less than any of the other indices we studied.
Cumulative change in price authority vs CPI-U, FYs 2011-2022:
-5.1%
Chained Consumer Price Index (Chained CPI)
Source: USPS OIG analysis.
Source: USPS OIG analysis.
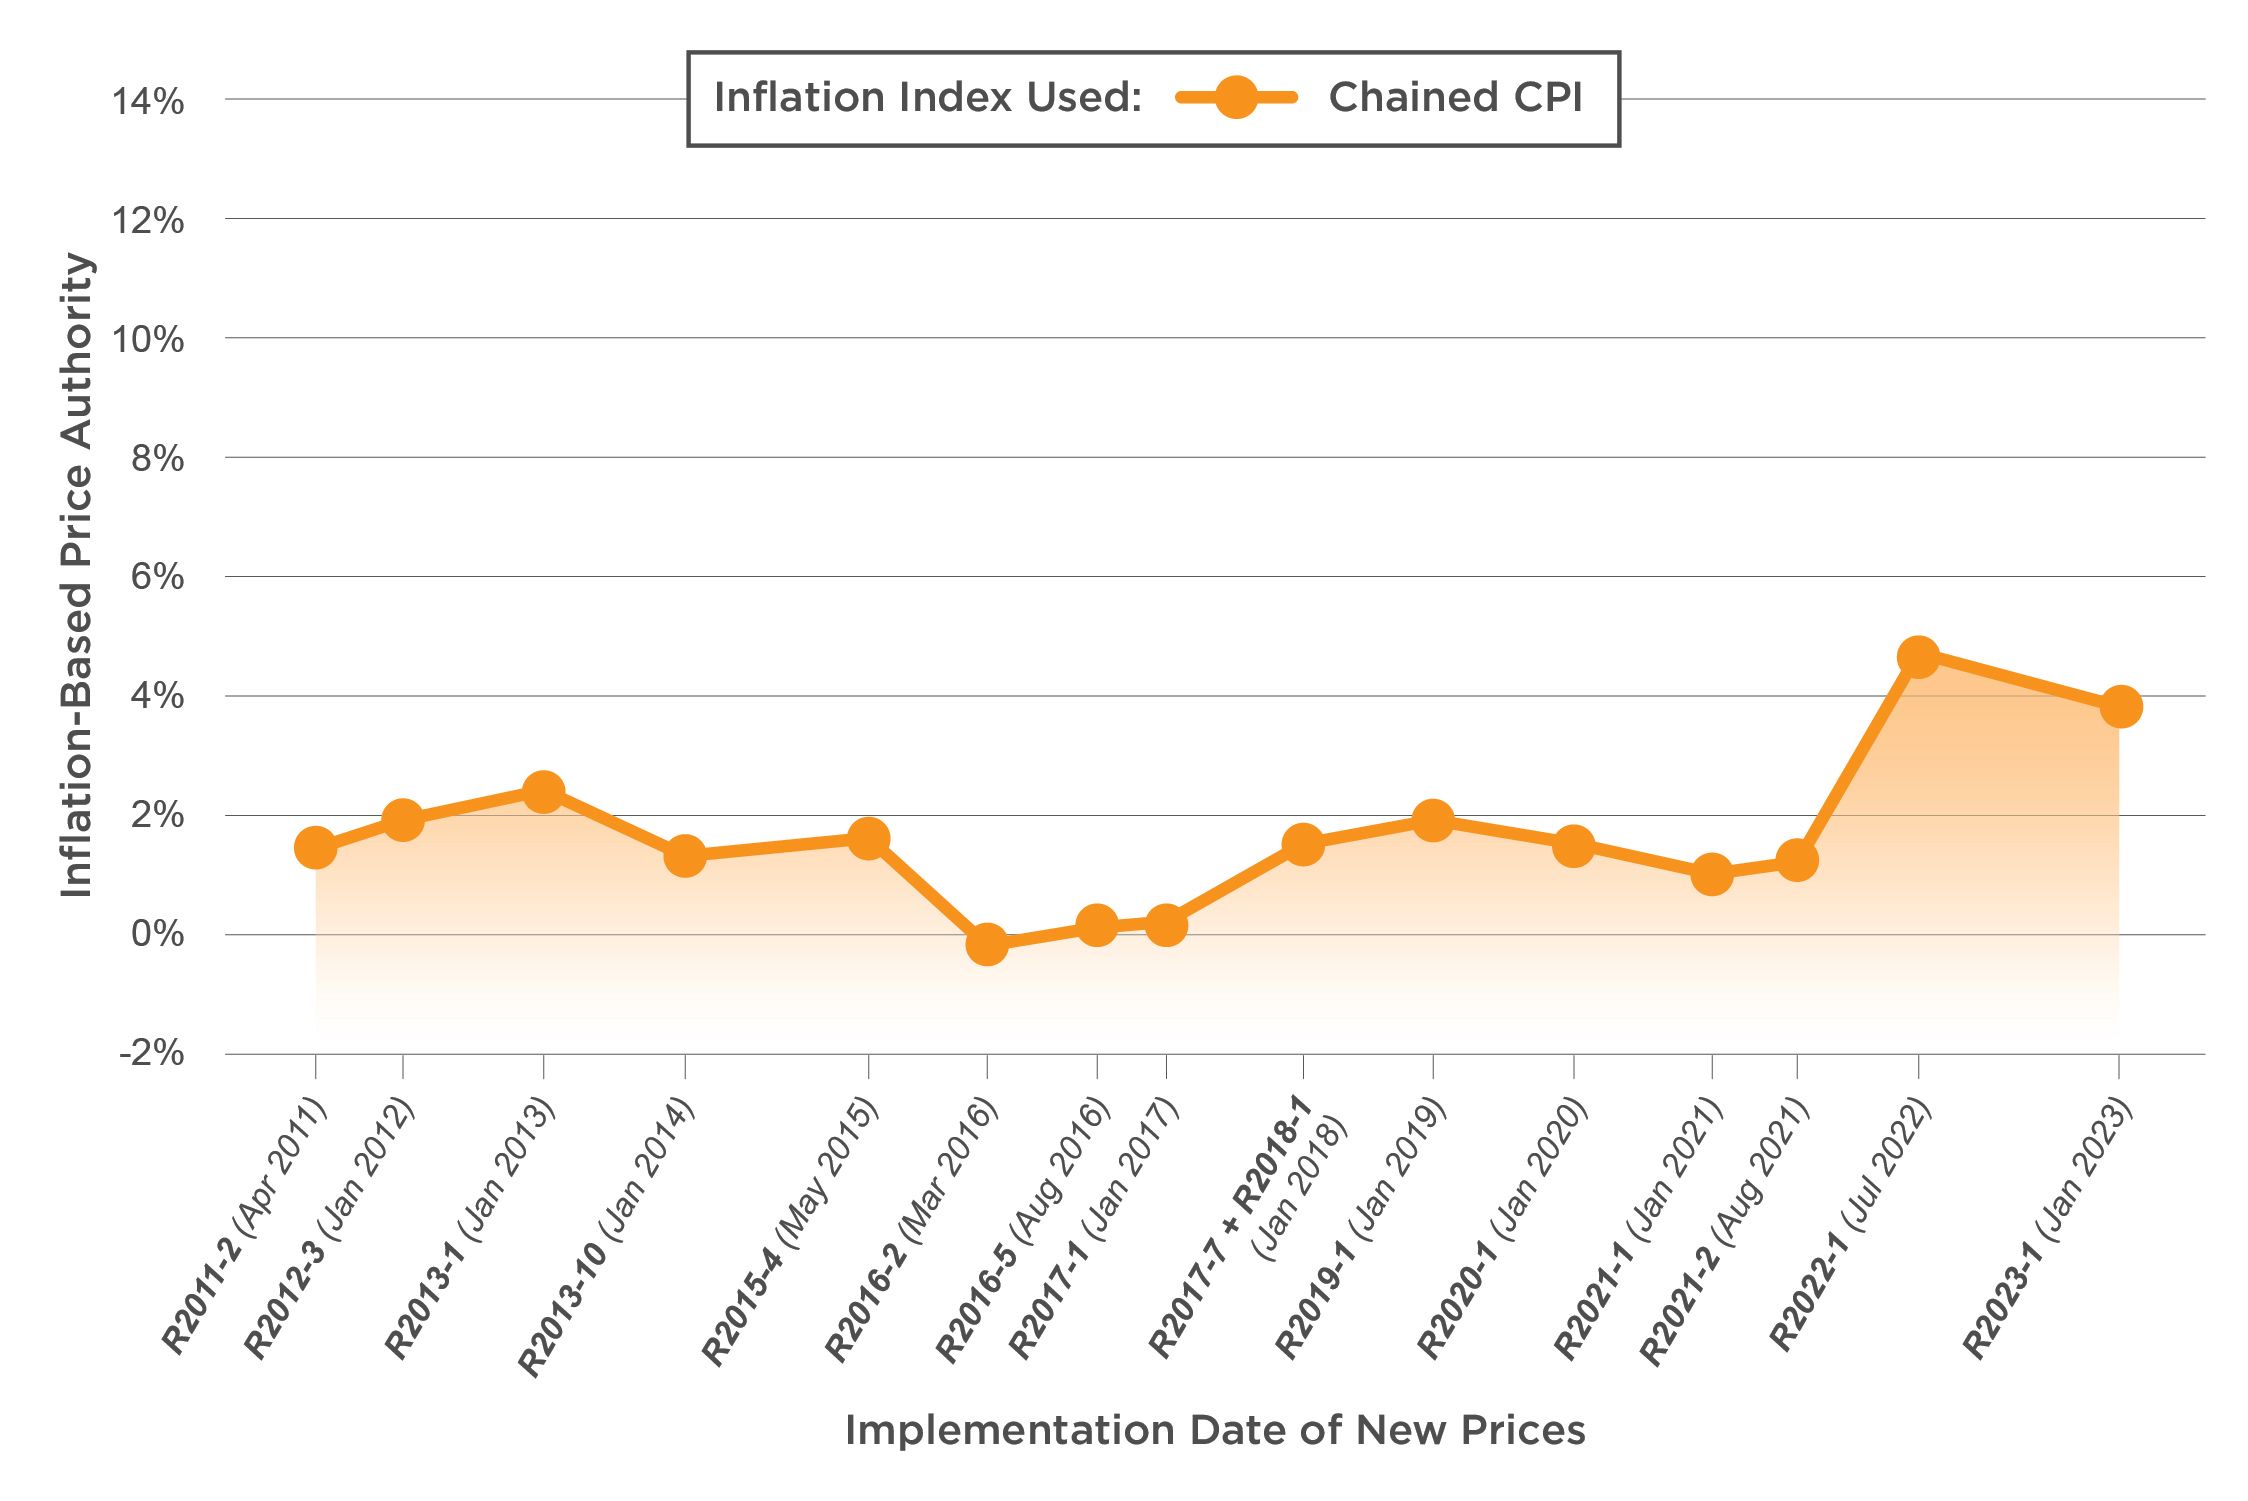
Using the Chained CPI would have also resulted in lower price increases than the CPI-U. It would have yielded less price authority in all but one rate case.
Cumulative change in price authority vs CPI-U, FYs 2011-2022:
-4.4%
Gross Domestic Product Price Index (GDP PI)
Source: USPS OIG analysis.
Source: USPS OIG analysis.
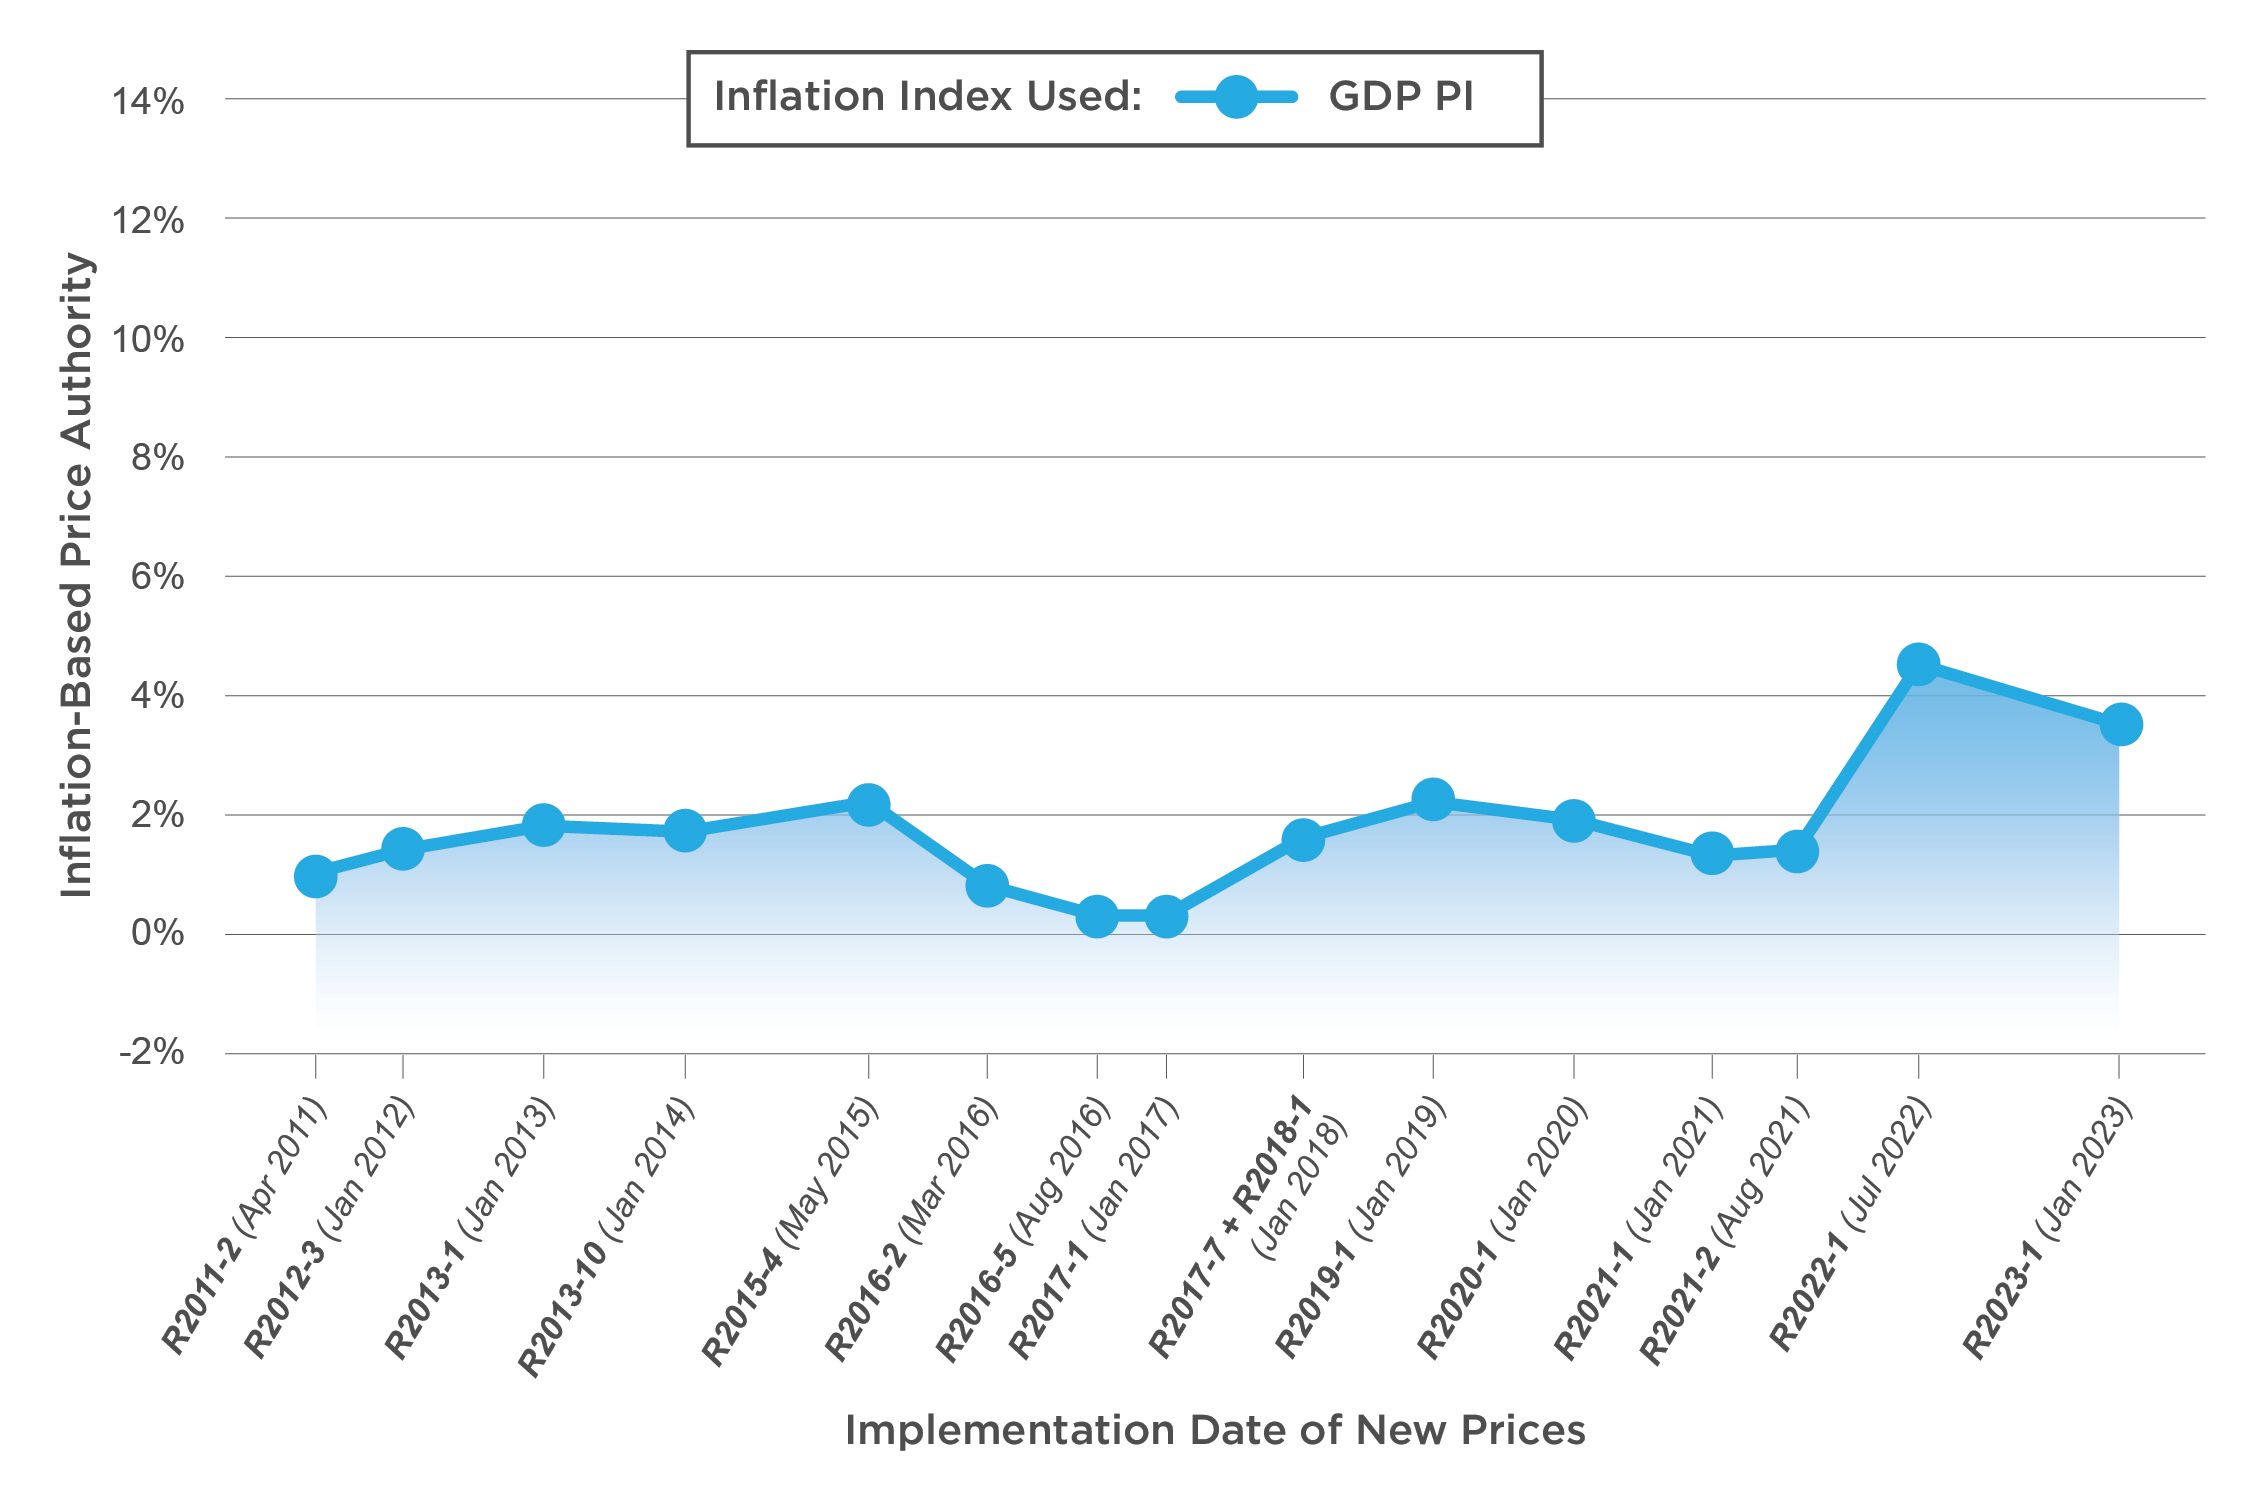
The trend is less clear with the GDP PI. Some rate cases would have yielded more authority than the CPI-U, while others would have yielded less. Overall, however, GDP PI's cumulative price authority would have been smaller than CPI-U's.
Cumulative change in price authority vs CPI-U, FYs 2011-2022:
-2.4%
Greater Price Authority: Three Indices
Meanwhile, three other indices would have yielded greater cumulative price authority than the CPI-U. One in particular — the CPI-Delivery Services inflation index — showed a much larger increase in inflation between FYs 2011 and 2022. However, this index is more volatile than the others.
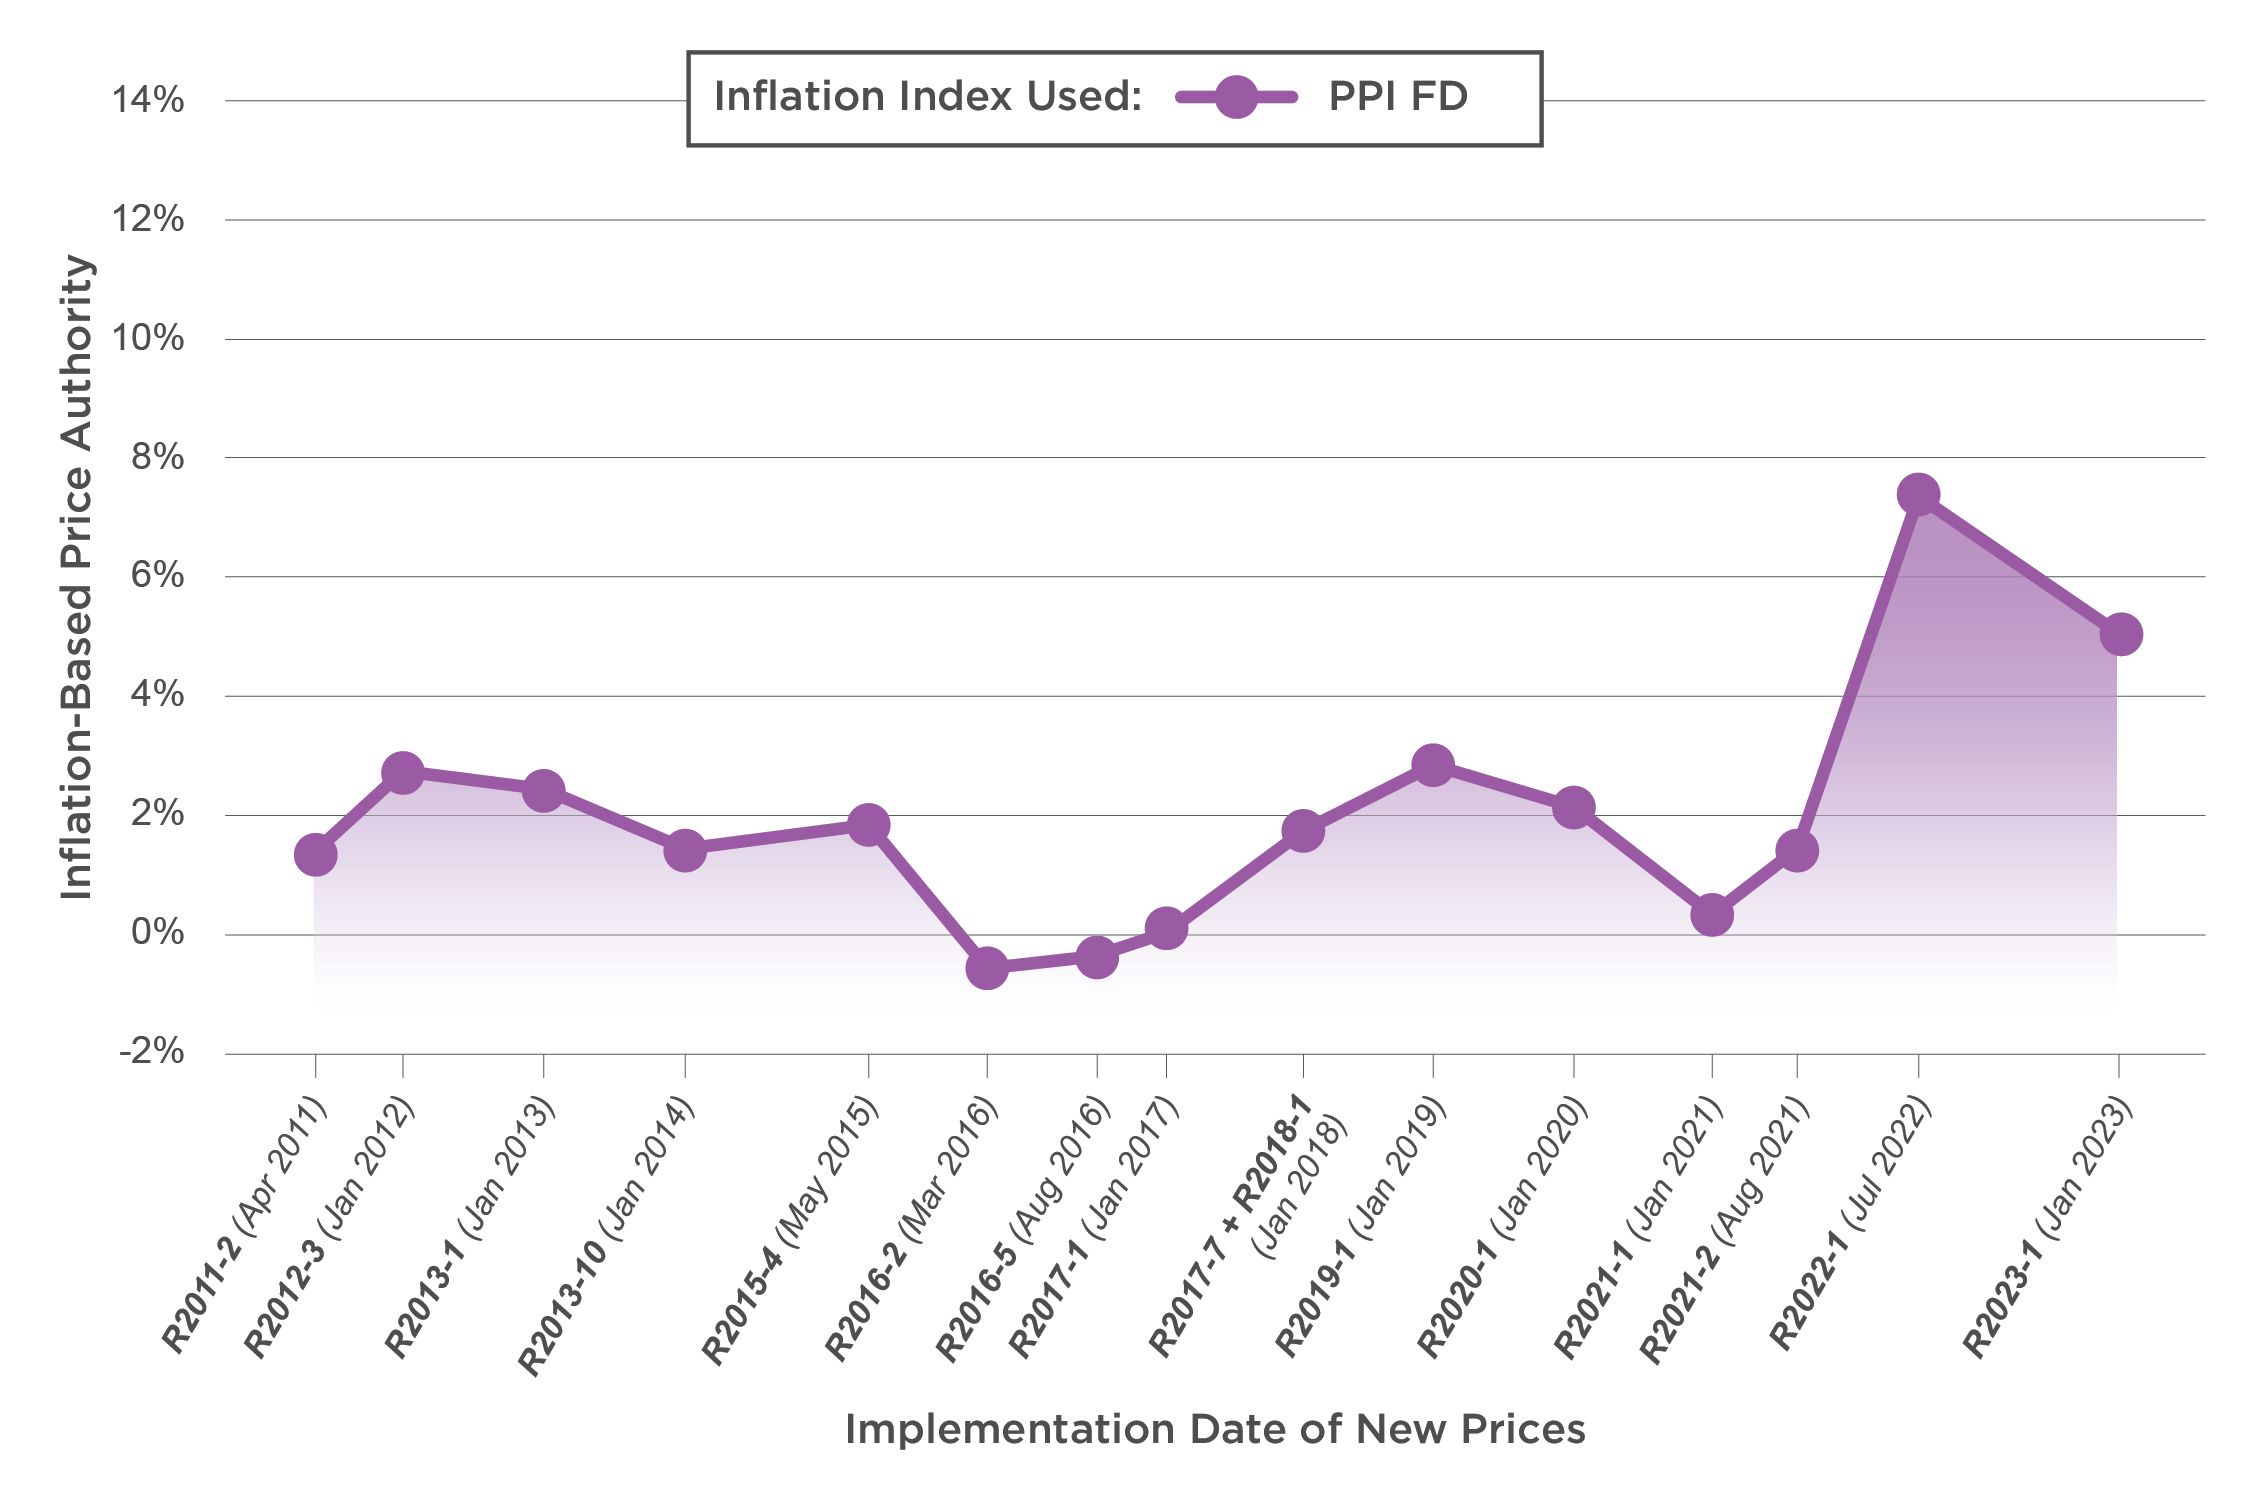
Producer Price Index for Final Demand (PPI FD)
Source: USPS OIG analysis.
Source: USPS OIG analysis.
Like the GDP PI, results for the PPI FD were not as clear as with other indices. Some rate cases would have yielded more authority than the CPI-U while others would have yielded less. Yet the PPI FD would have provided USPS with slightly more cumulative price authority than the CPI-U.
Cumulative change in price authority vs CPI-U, FYs 2011-2022:
+1.6%
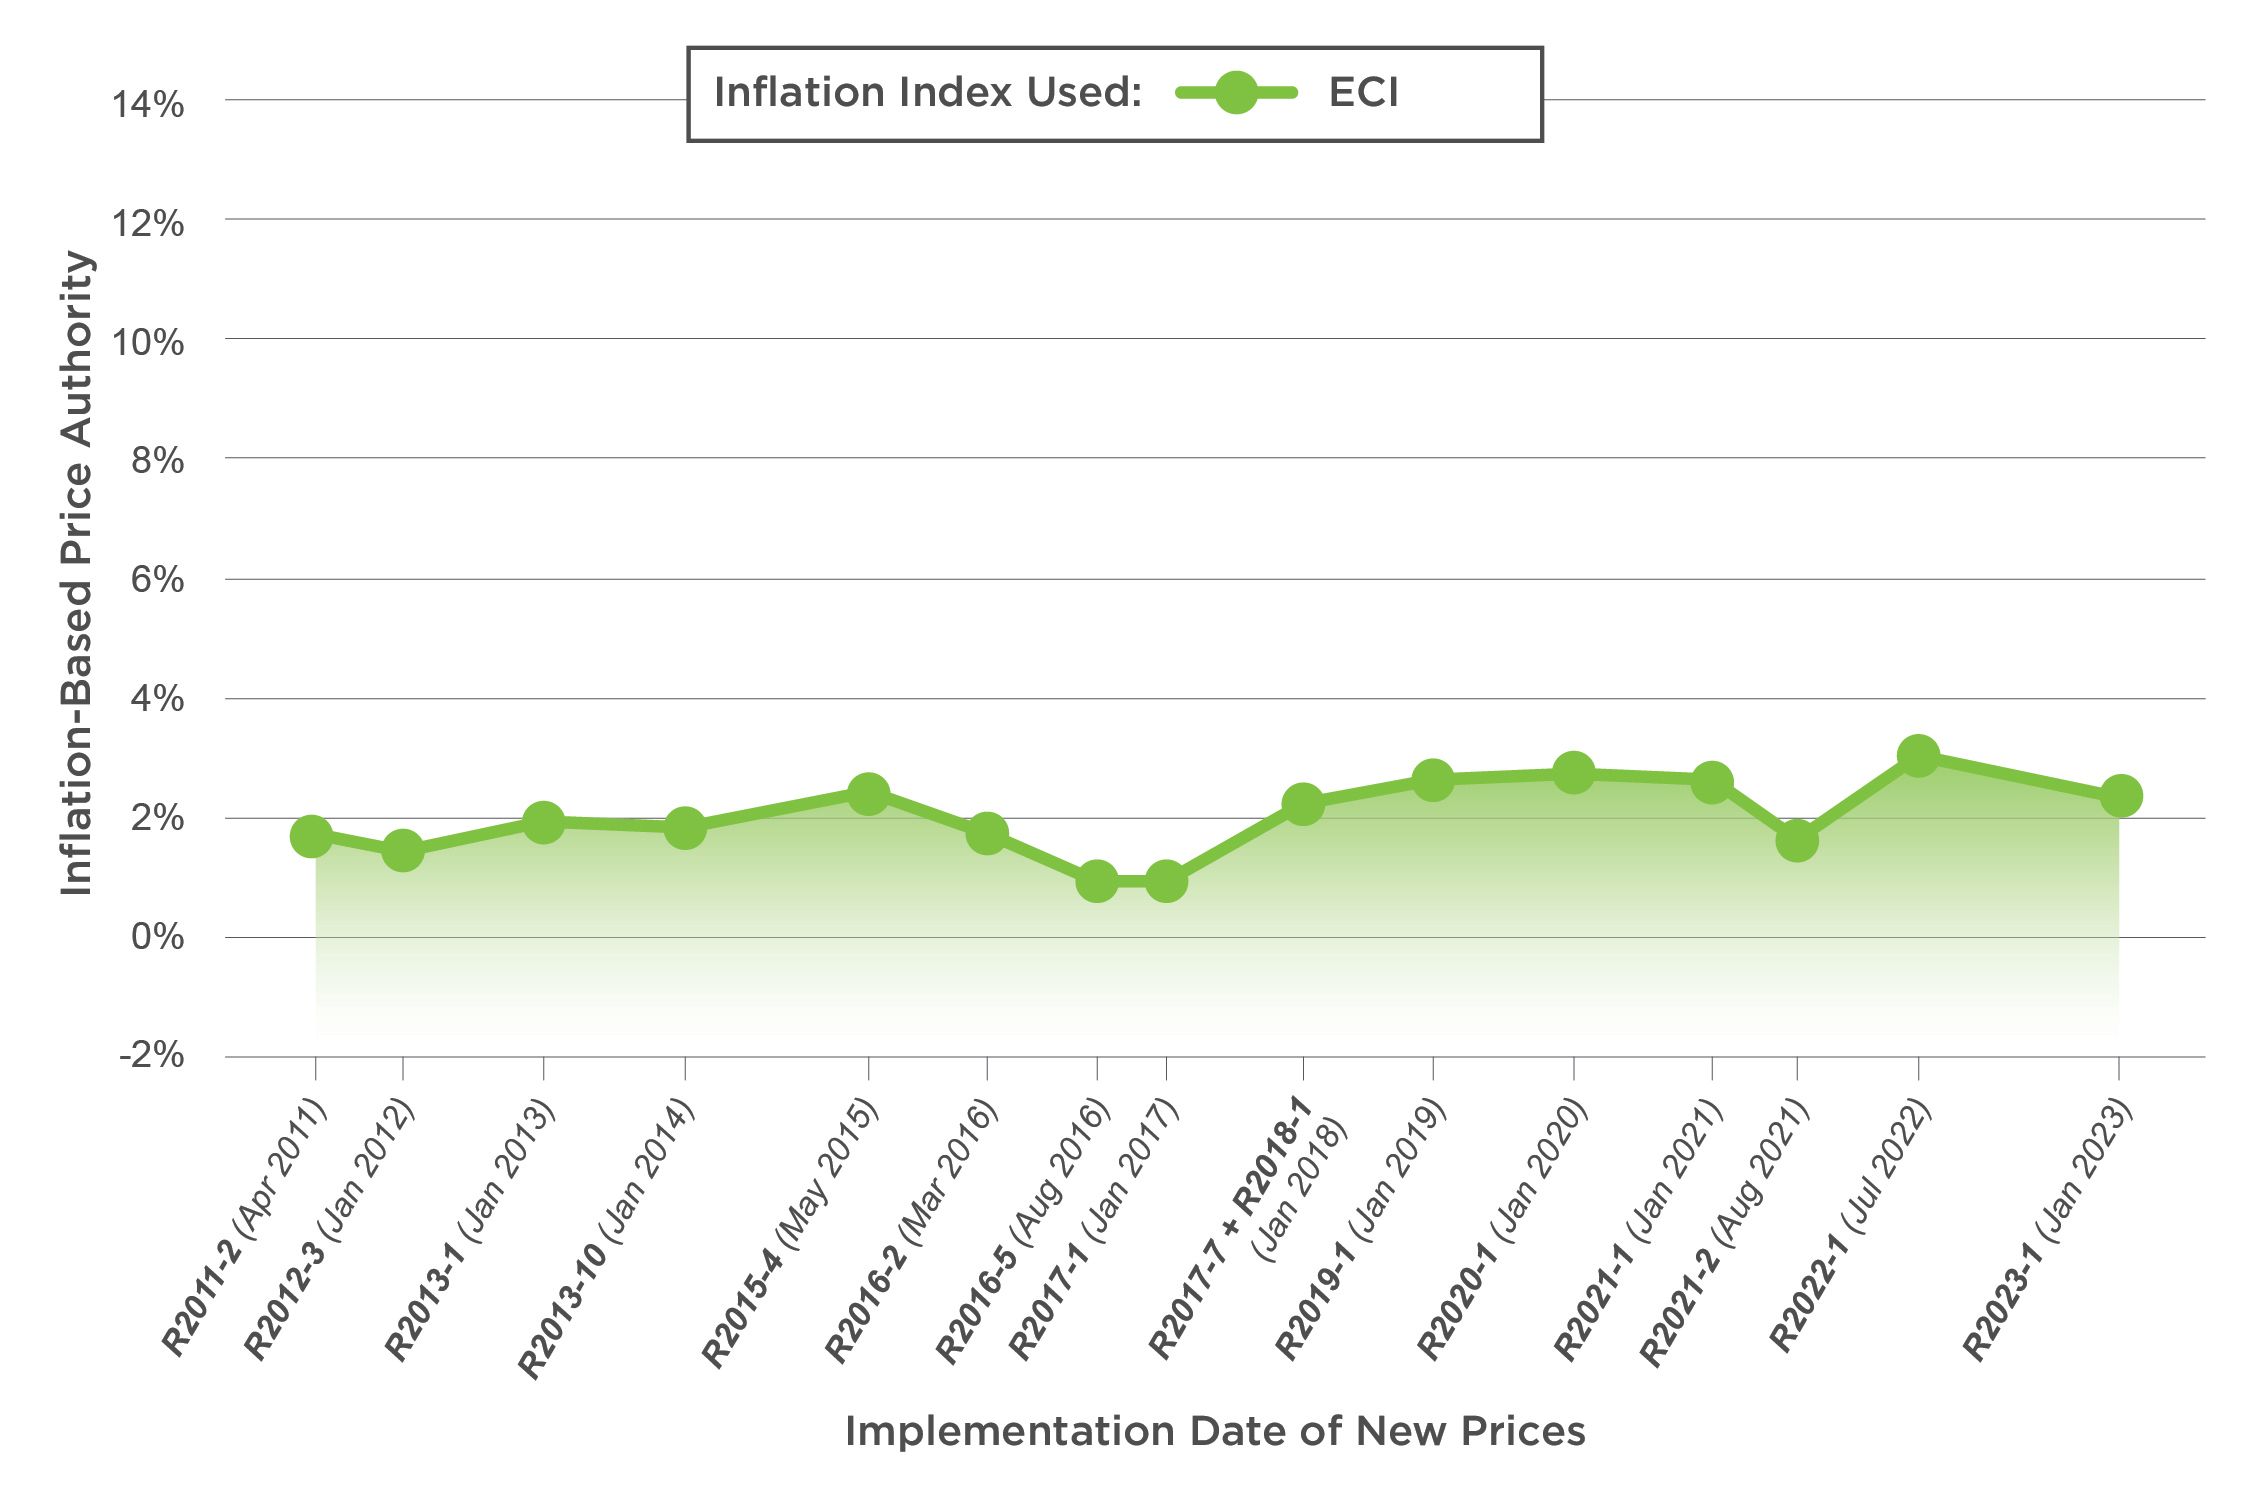
Employment Cost Index (ECI)
Source: USPS OIG analysis.
Source: USPS OIG analysis.
The ECI would have allowed more authority than the CPI-U in 12 of 16 rate cases, resulting in a cumulative price authority that was 2.8 percentage points higher than the CPI-U's.
Cumulative change in price authority vs CPI-U, FYs 2011-2022:
+2.8%
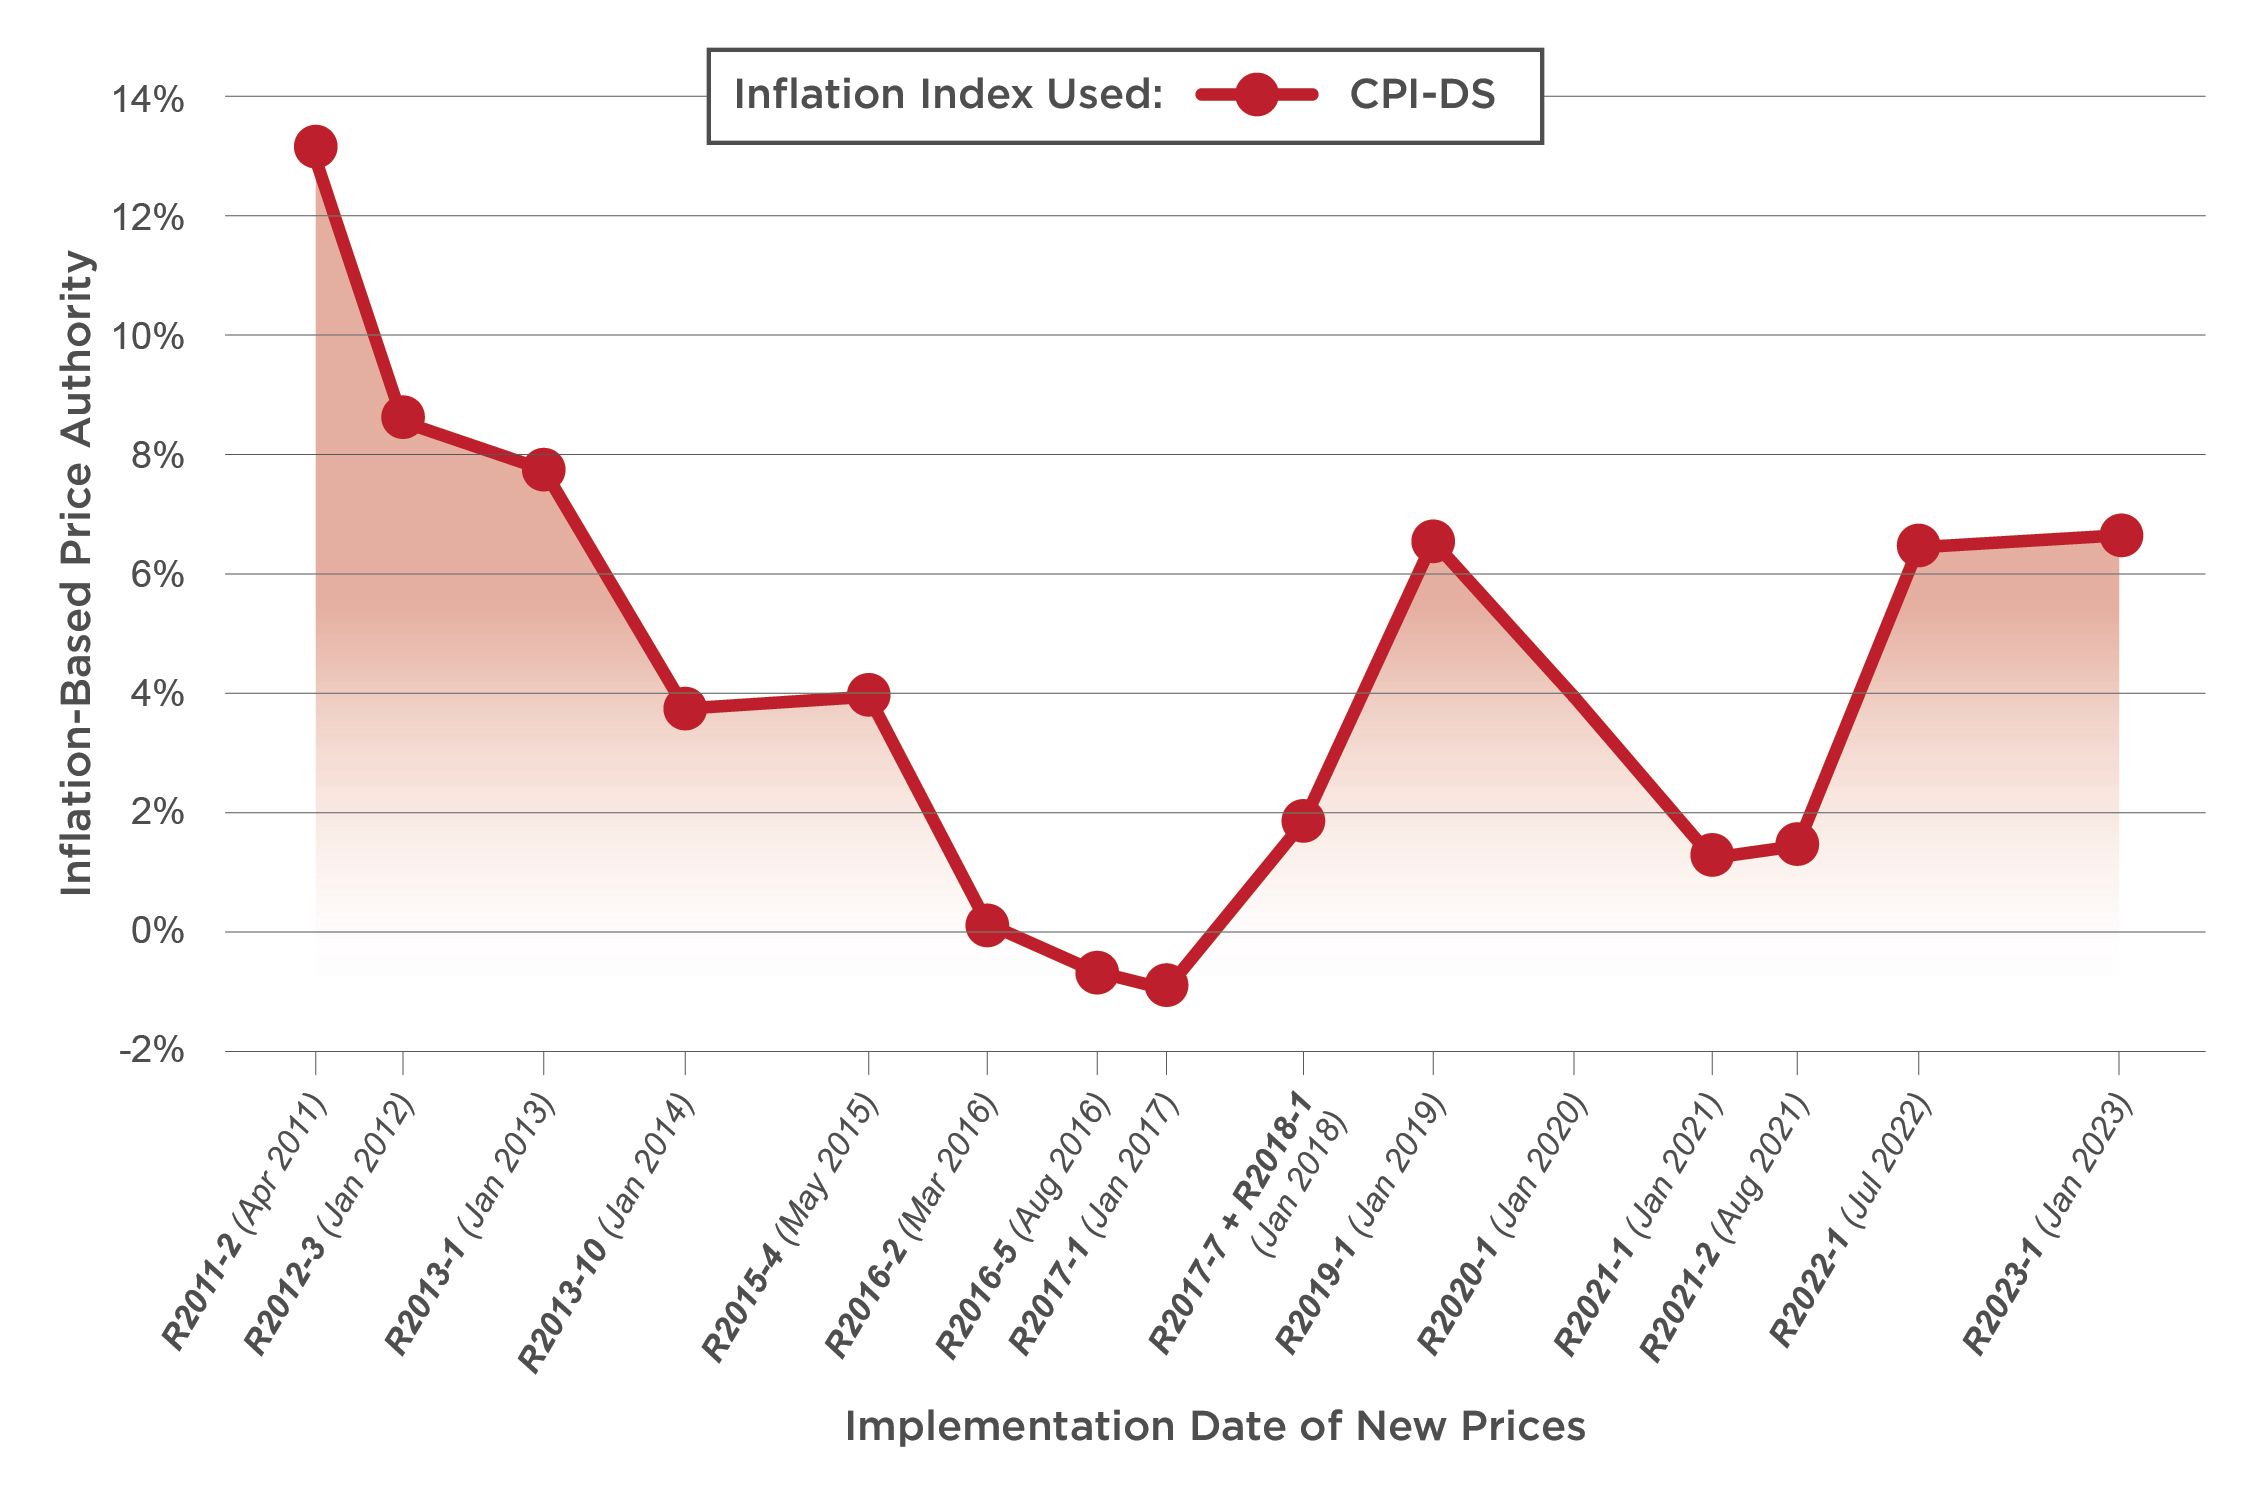
Consumer Price Index for Delivery Services (CPI-DS)
Source: USPS OIG analysis.
Source: USPS OIG analysis.
Finally, the CPI-DS would have allowed significantly higher price increases compared to other indices. A CPI-DS-based authority would have yielded more price authority in 12 of 16 rate cases.
The CPI-DS is an unusual index. It is more volatile and narrower in scope than other indices because it is based on private sector retail shipping prices. Our analysis of the CPI-DS price cap did not consider price elasticity, which measures the potential impact of significantly higher prices on volume. However, dramatic price increases under the CPI-DS might have caused customers to send fewer mailpieces, which would then limit potential revenue gains under this index.
Cumulative change in price authority vs CPI-U, FYs 2011-2022:
+53.1%
International Posts and Their Price Caps


The U.S. Postal Service's price cap applies to 95% of the agency's total volume — including First-Class Mail and Standard Mail — and relies on the CPI-U for its calculation. How does our price cap compare to other countries?
We examined price caps for postal operators in seven countries and studied products covered by each price cap. All seven international posts featured a version of the CPI within their price cap calculations. However, USPS's price cap covered far more volume than price caps in other countries, which ranged from 5% of total volume in Sweden to over 60% in Germany.
International Comparisons
France
|
Inflation Index Used |
|---|
|
CPI based on a forecast |
|
Products Included in the Price Cap |
|
• All single piece and bulk letter mail • Parcels, excluding international inbound |
|
Total Volume Covered by Price Cap |
|
Price cap covers about 75% of letter mail and one-third of parcels |
Germany
|
Inflation Index Used |
|---|
|
CPI based on past inflation and a forecast |
|
Products Included in the Price Cap |
|
• Letters up to 1 kg |
|
Total Volume Covered by Price Cap |
|
Price cap covers 63% of total volume |
Portugal
|
Inflation Index Used |
|---|
|
CPI based on past inflation |
|
Products Included in the Price Cap |
|
• Correspondence up to 2 kg, excluding marketing mail • Parcels up to 10 kg |
|
Total Volume Covered by Price Cap |
|
Price cap covers about 30-40% of volume |
Netherlands
|
Inflation Index Used |
|---|
|
CPI based on a forecast |
|
Products Included in the Price Cap |
|
• Single piece letters up to 2 kg • Parcels up to 10 kg |
|
Total Volume Covered by Price Cap |
|
Price cap covers about 14% of volume |
Sweden
|
Inflation Index Used |
|---|
|
CPI based on past inflation |
|
Products Included in the Price Cap |
|
• Stamped letters up to 250 grams |
|
Total Volume Covered by Price Cap |
|
Price cap covers about 4-5% of total volume |
United Kingdom
|
Inflation Index Used |
|---|
|
CPI based on past inflation |
|
Products Included in the Price Cap |
|
• Second class standard letters • Second class large letters, packets, and parcels up to 2 kg |
|
Total Volume Covered by Price Cap |
|
Price cap covers less than 5% of total volume (estimated from total revenue) |
Belgium
|
Inflation Index Used |
|---|
|
Health Index based on past inflation |
|
Products Included in Price Cap |
|
• Single piece domestic standard letters up to 2 kg • Parcels up to 10kg • International standard mail up to 2 kg |
|
Total Volume Covered by Price Cap |
|
Price cap covers about 25% of total volume |
Future Decisions


In the United States and abroad, price cap debates have revolved around additional price authorities rather than merits of an alternative inflation index. The PRC had an option to replace the CPI-U following its 10-year review. Like other international regulators, the PRC decided to authorize new adjustment factors instead.
A follow-up review is scheduled for 2025. Once again, the Postal Service and the PRC will grapple with complex decisions surrounding USPS’s ratemaking system. The regulatory challenge will lie in keeping prices affordable for customer mail needs while enabling USPS's financial viability.
For more details, insights, and analysis, read the full report on our website by clicking on the image below.


Additional Resources

Inflation and the U.S. Postal Service
Published in 2022, this OIG white paper offers a qualitative assessment of the impacts of inflation on the Postal Service’s costs and revenue while highlighting how USPS manages inflation-related risks.

Examining Changes in Postal Product Costs
This OIG white paper examines and analyzes the Postal Service's product costs and cost changes from fiscal years 2006 through 2015.

Revisiting the CPI-Only Price Cap Formula
This 2013 white paper analyzed the impact of pricing regulations on the financial condition of the Postal Service, laying the foundation for the OIG's current work on the subject.
Contact Us
For media inquiries, please email press@uspsoig.gov.